
If you end up here, you might ask, “What are Prometheus and Grafana?" or “How can Grafana and Prometheus be used to monitor AWS resources?" or "What is the difference between Prometheus and Grafana?”, and a lot more.
Introduction Monitoring our resources is a crucial part of any development and its deployment; this is where Prometheus and Grafana come into play. Prometheus is an open-source tool to monitor and send alerts if anything goes wrong. Grafana is also an open-source tool for analytics and visualization. If both tools are used together, they become a real power combo. In this blog, we will explore how to install and set up Prometheus and Grafana and use them to monitor resources on Amazon Web Services. We will walk you through the process of setting up Node Exporter and Grafana for visualizing the collected metrics on AWS. We have already covered setting up Prometheus on AWS. So, let's get started with the Prometheus and Grafana tutorial!!

Setting up Node-Exporter on EC2 Setting up Node-Exporter is similar to setting up Prometheus. If you have not yet read the blog on setting up Prometheus, we would highly recommend you go check it out. Follow these steps to set up Node-Exporter on EC2:
- For this, we will first create a user: sudo useradd --no-create-home node_exporter.
- Then we have to install node-exporter and go to Downloads for the latest node-exporter link. #This will download the version 1.7.0 wget https://github.com/prometheus/node_exporter/releases/download/v1.7.0/node_exporter-1.7.0.linux-amd64.tar.gz
- We will then untar the downloaded file and copy the node_exporter binary to the /usr/local/bin directory. tar xzf node_exporter-1.7.0.linux-amd64.tar.gz sudo cp node_exporter-1.7.0.linux-amd64/node_exporter /usr/local/bin/node_exporter rm -rf node_exporter-1.7.0.linux-amd64.tar.gz node_exporter-1.7.0.linux-amd64 4. Now that we have installed it, we will configure the service. sudo vi /etc/systemd/system/node-exporter.service 5. We will now add configuration to the service file. [Unit] Description=Prometheus Node Exporter Service After=network.target [Service] User=node_exporter Group=node_exporter Type=simple ExecStart=/usr/local/bin/node_exporter [Install] WantedBy=multi-user.target 6. Now we have to configure systems. #This will reload the daemon to add the newly made configuration sudo systemctl daemon-reload #This will enable node exporter sudo systemctl enable node-exporter #This starts the node-exporter sudo systemctl start node-exporter #This will check the status sudo systemctl status node-exporter This should start the node_exporter server, which you can see by using <your-public-ip>:9100 or you can use <your-public-Ipv4-dns>:9100 and it would look something like this:
And the <your-public-ip>:9100/metrics or <your-public-Ipv4-dns>:9100 would show the data that your node_exporter is scrapping.
Once the server is running, we now have to make a few adjustments in our prometheus.yml file to fetch the node-exporter server and to do that, add these configurations in the prometheus.yml file. global: scrape_interval: 15s external_labels: monitor: 'prometheus' scrape_configs: - job_name: 'prometheus' static_configs: - targets: ['localhost:9090'] - job_name: 'node_exporter' static_configs: - targets: ['localhost:9100'] After updating the configuration, restart your daemon using suso systemctl daemon-reload then sudo systemctl restart prometheus. Then go to the Prometheus dashboard and navigate to Target under the status drop-down (top-left).
Hurray!! We perfectly set up our node_exporter and the Prometheus endpoints. From this page, you can check their status, labels, last scrape, and much more information. Now, let's connect our endpoints with Grafana to get a much more detailed and informative dashboard.
Setting up Grafana on EC2 Installing Grafana on EC2 is comparatively easier. Let's look at the steps on how to easily set up Grafana on EC2: First, we need to install some prerequisite packages. sudo apt-get install -y apt-transport-https software-properties-common wget Then, import GPG keys ( GPG has a public-private key pair where the public key is shared and the private key is kept secret ). sudo mkdir -p /etc/apt/keyrings/ wget -q -O - https://apt.grafana.com/gpg.key | gpg --dearmor | sudo tee /etc/apt/keyrings/grafana.gpg > /dev/null This command configures APT to recognize the Grafana APT repository by adding the repository information to a new file: /etc/apt/sources.list.d/grafana.list. After running this command, you can use APT to install Grafana and receive updates from the Grafana repository. echo "deb [signed-by=/etc/apt/keyrings/grafana.gpg] https://apt.grafana.com stable main" | sudo tee -a /etc/apt/sources.list.d/grafana.list Time to install Grafana. #First Update sudo apt update #Install Grafana sudo apt-get install grafana Now that we have installed Grafana in our instance, it's time to start the Grafana server. Use the command to start the grafana-server. #Start server sudo systemctl start grafana-server #Check status sudo systemctl status grafana-server Congratulations! You have successfully started the Grafana server. It's time to open the Grafana server and see the magic! To open the Grafana Server, use your IP or Public IPv4 DNS with a 3000 port.
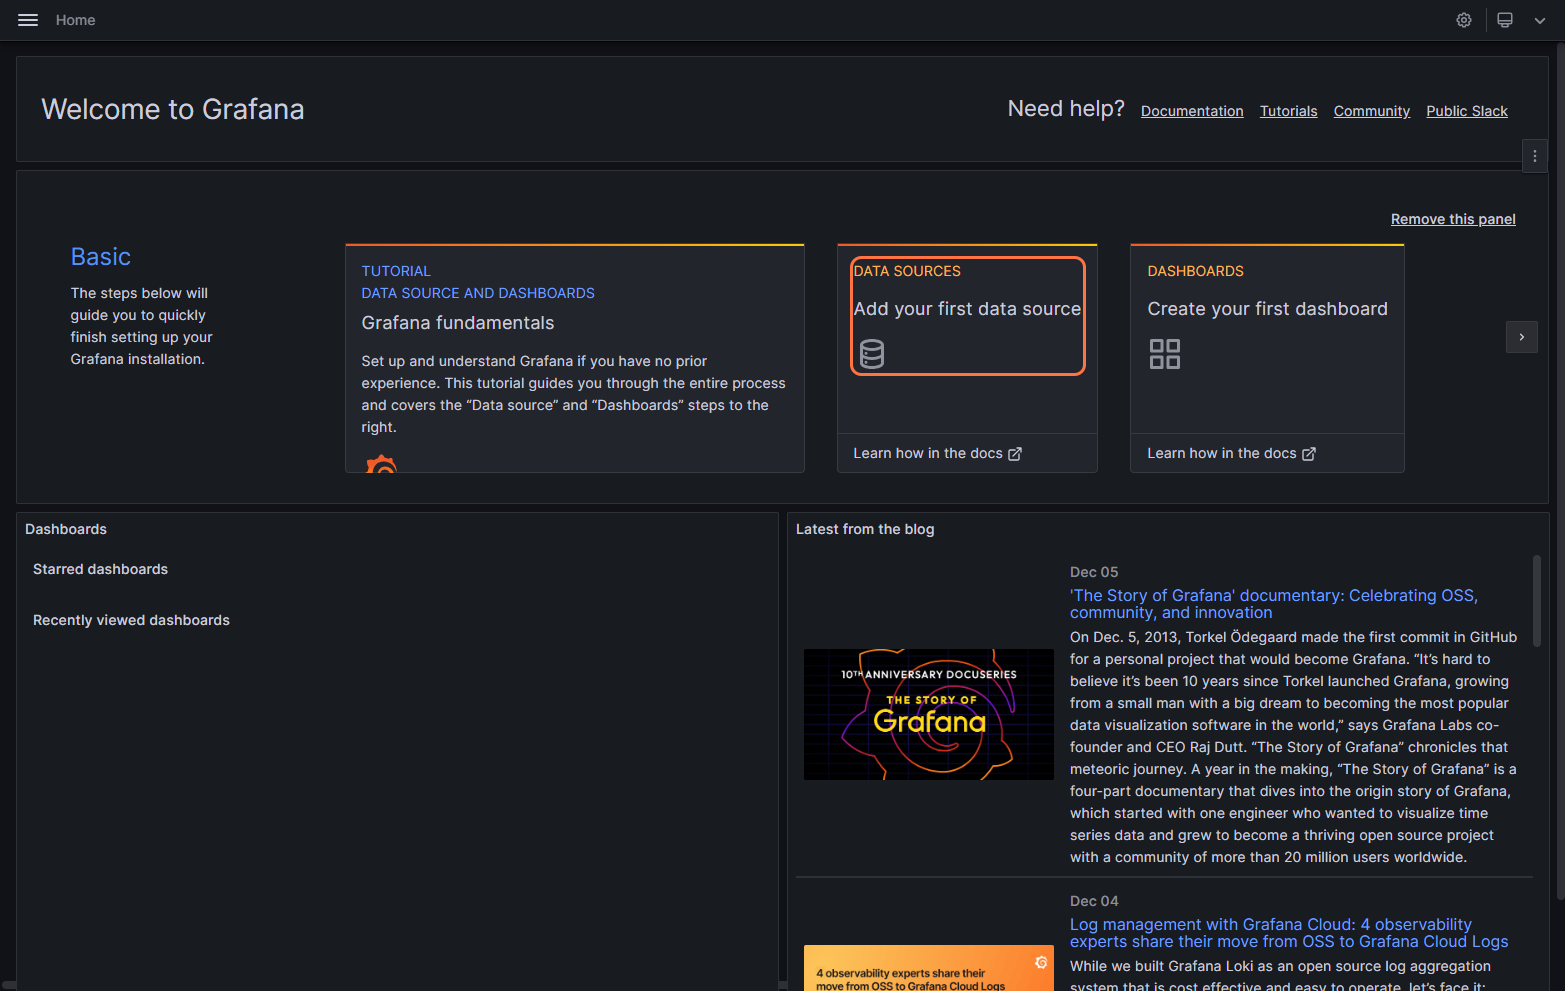
To log in to Grafana, use admin as your username/email and admin as your password. It will ask you to create a new password, create a new password, and submit.
The Grafana looks something like this.
Using Grafana to monitor Now that we have come so far, we need to visualize the resources that we have created. We will be using Grafana and the Grafana Dashboard to do so. Let's start with how we can monitor using Grafana.
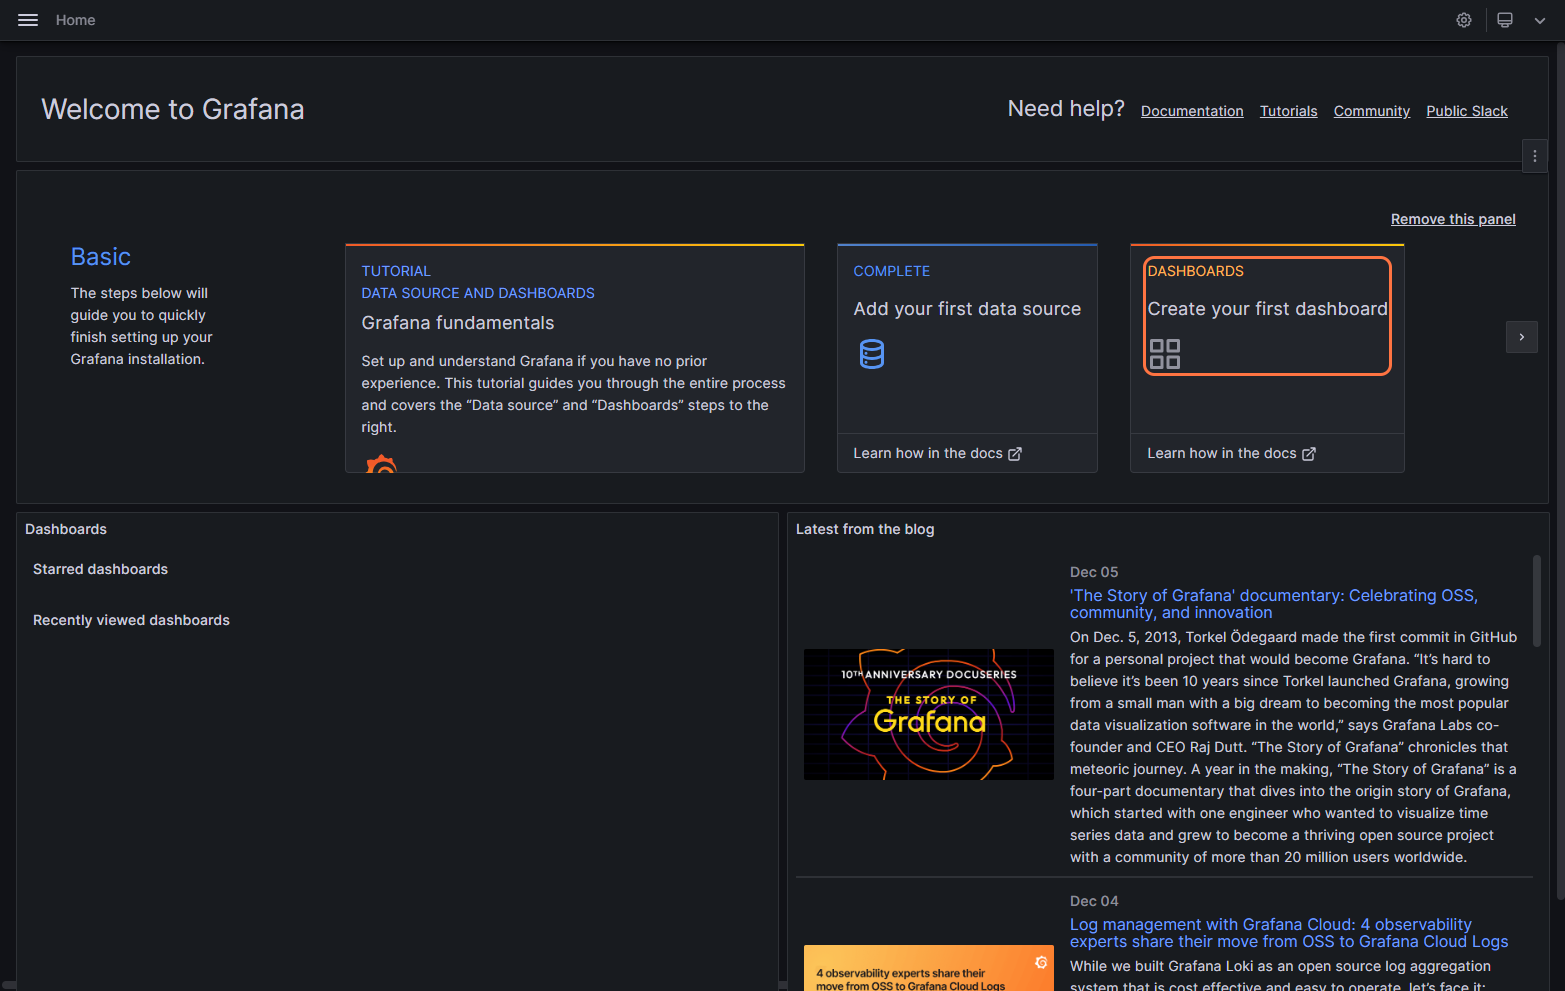
Creating Data Sources Once you open the page, you will see Data Sources, go to Data Sources.
Need help with your cloud infrastructure?
Our experts at CloudZenia are ready to help you build, scale, and secure your setup.
Book a Free Consultation•
- Select Prometheus as the Time Series Databases.
- In the connection section, we will enter the Prometheus server URL. Since we are working on the same server, we will use http://localhost:9090. After this, go down and click Save and Test.
Creating Dashboard
- Navigate back to home and go to Dashboards.
2. Now click on import dashboard; we will be importing the dashboard for our node_exporter from grafana.com/dashboards .
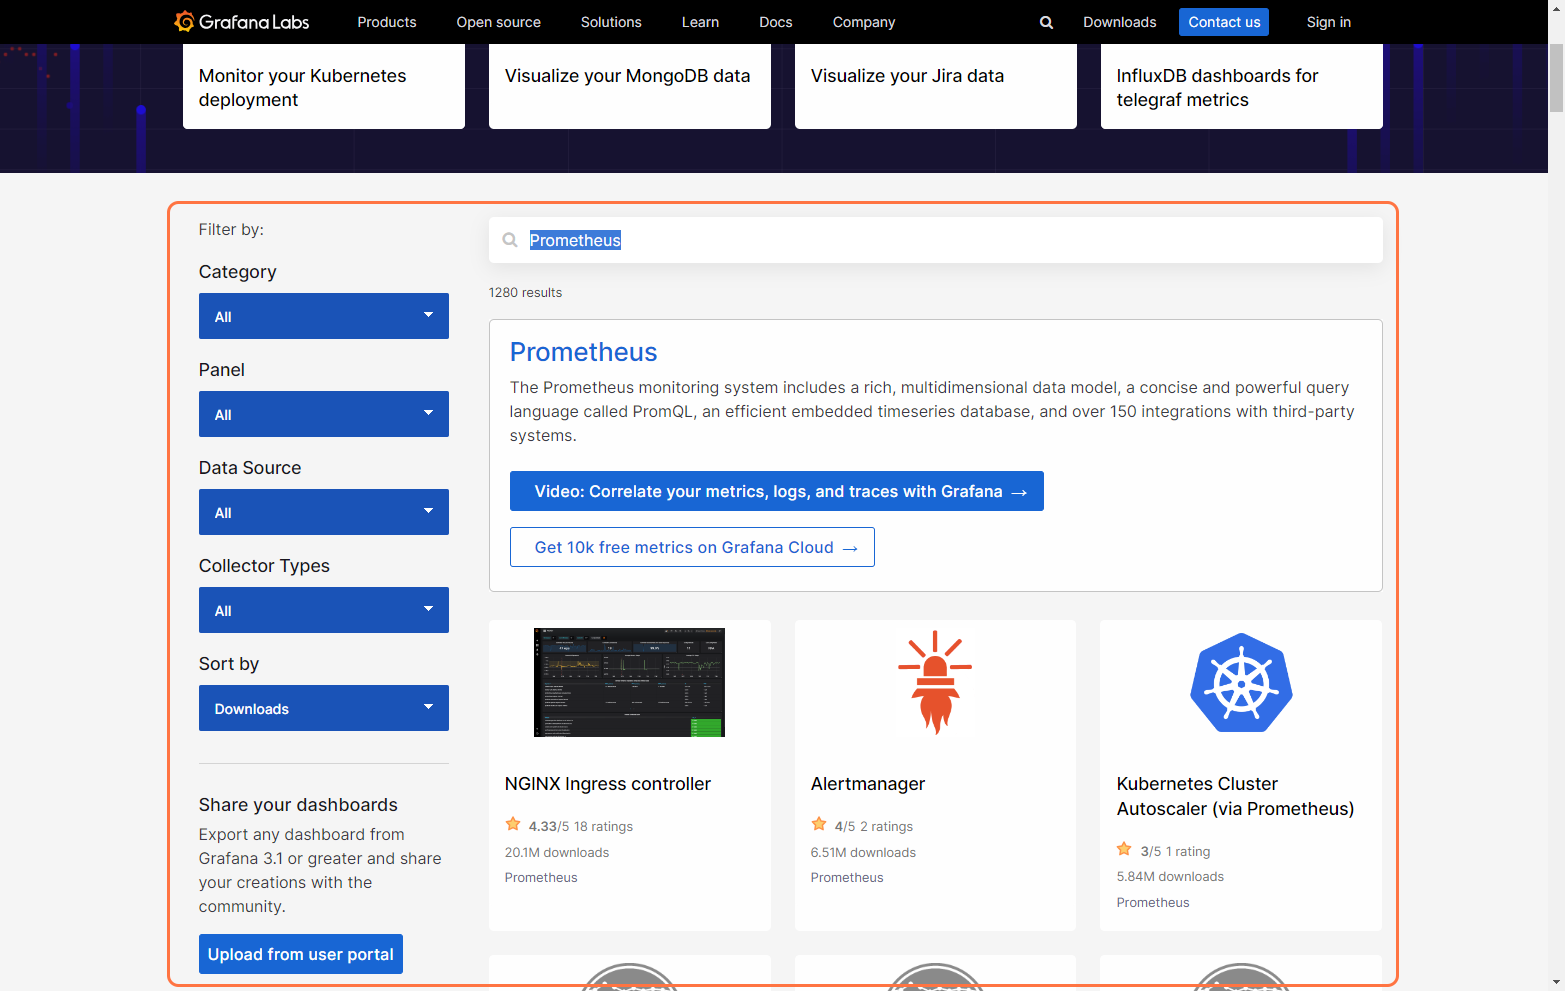
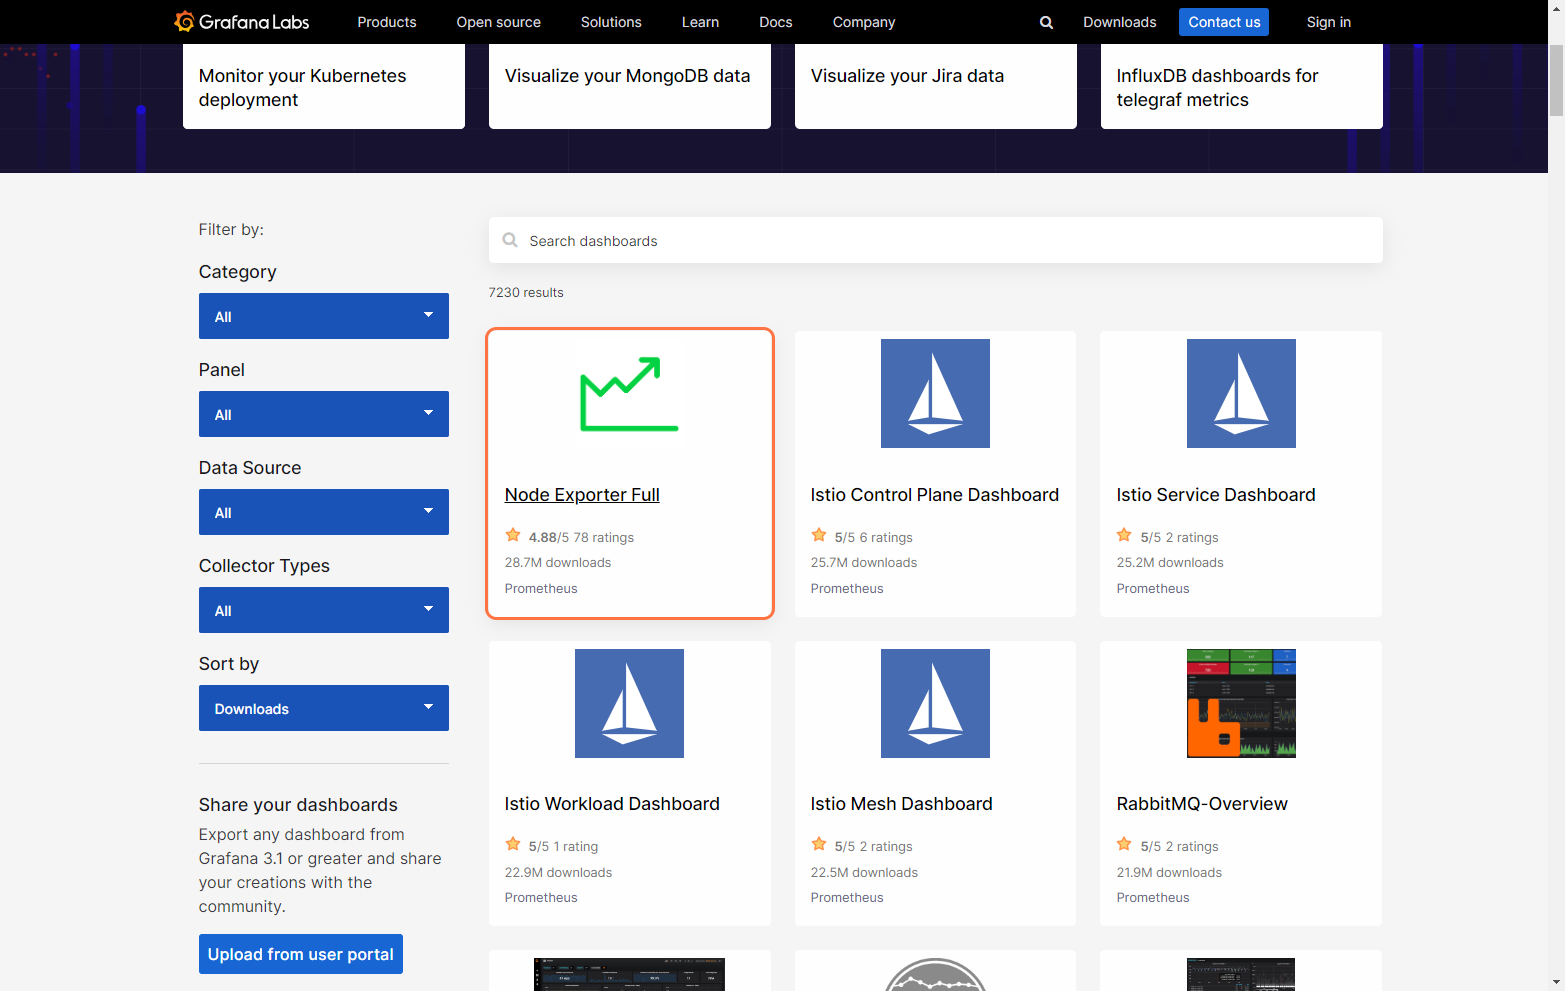
3. Search for Node Exporter Full and open it.
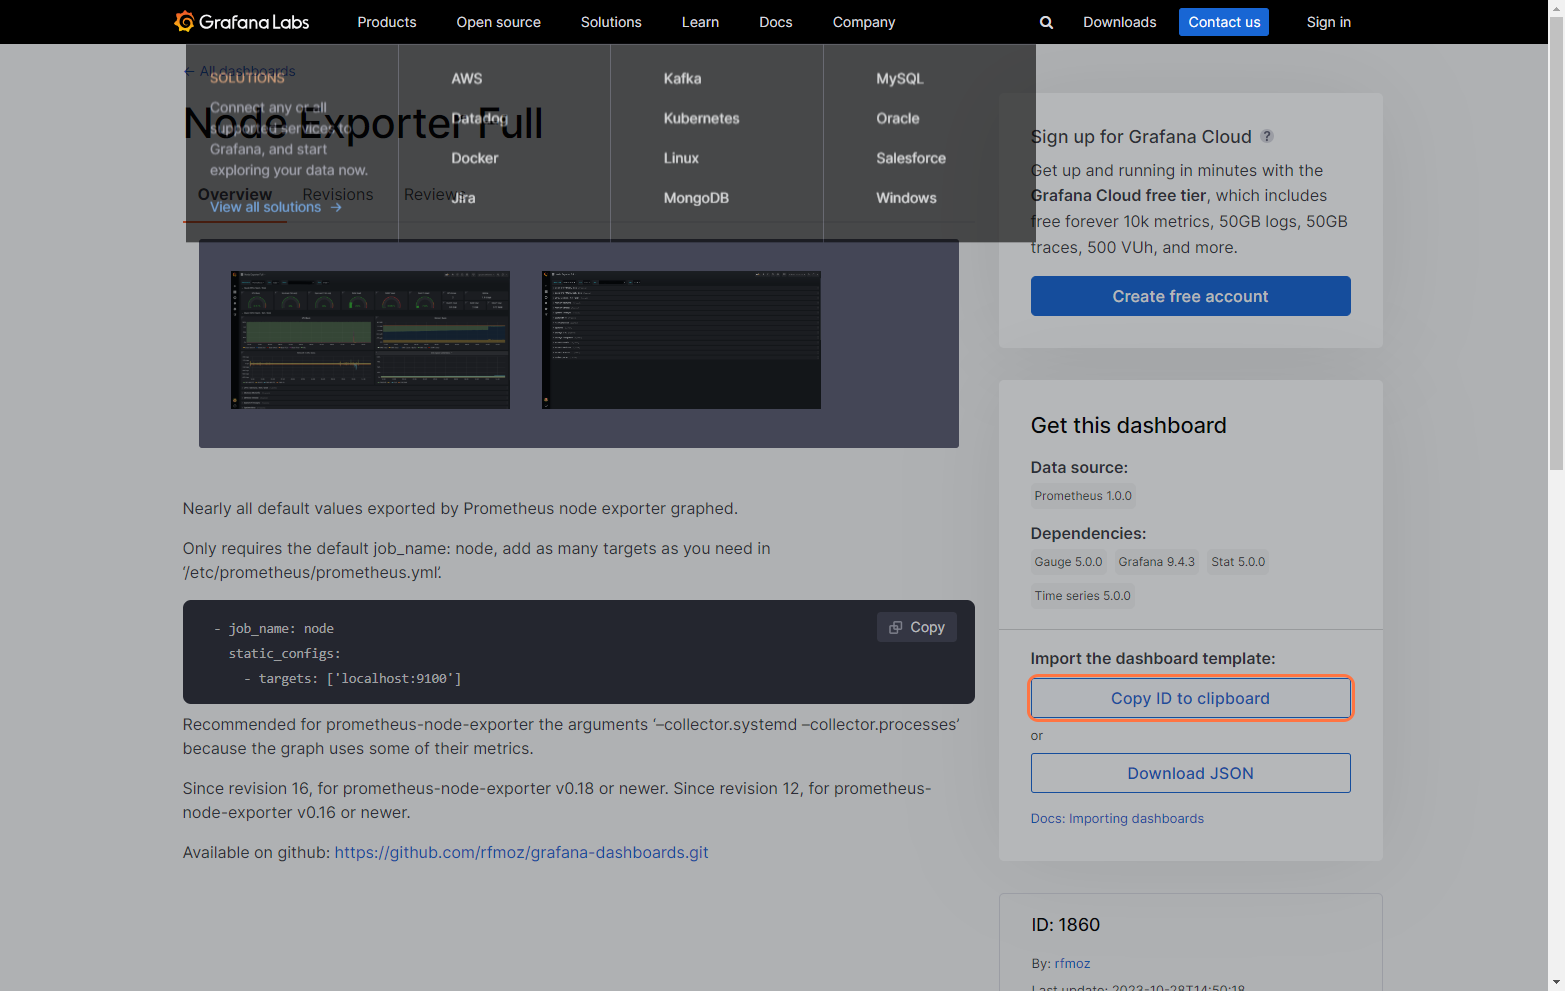
4. Copy the dashboard ID.
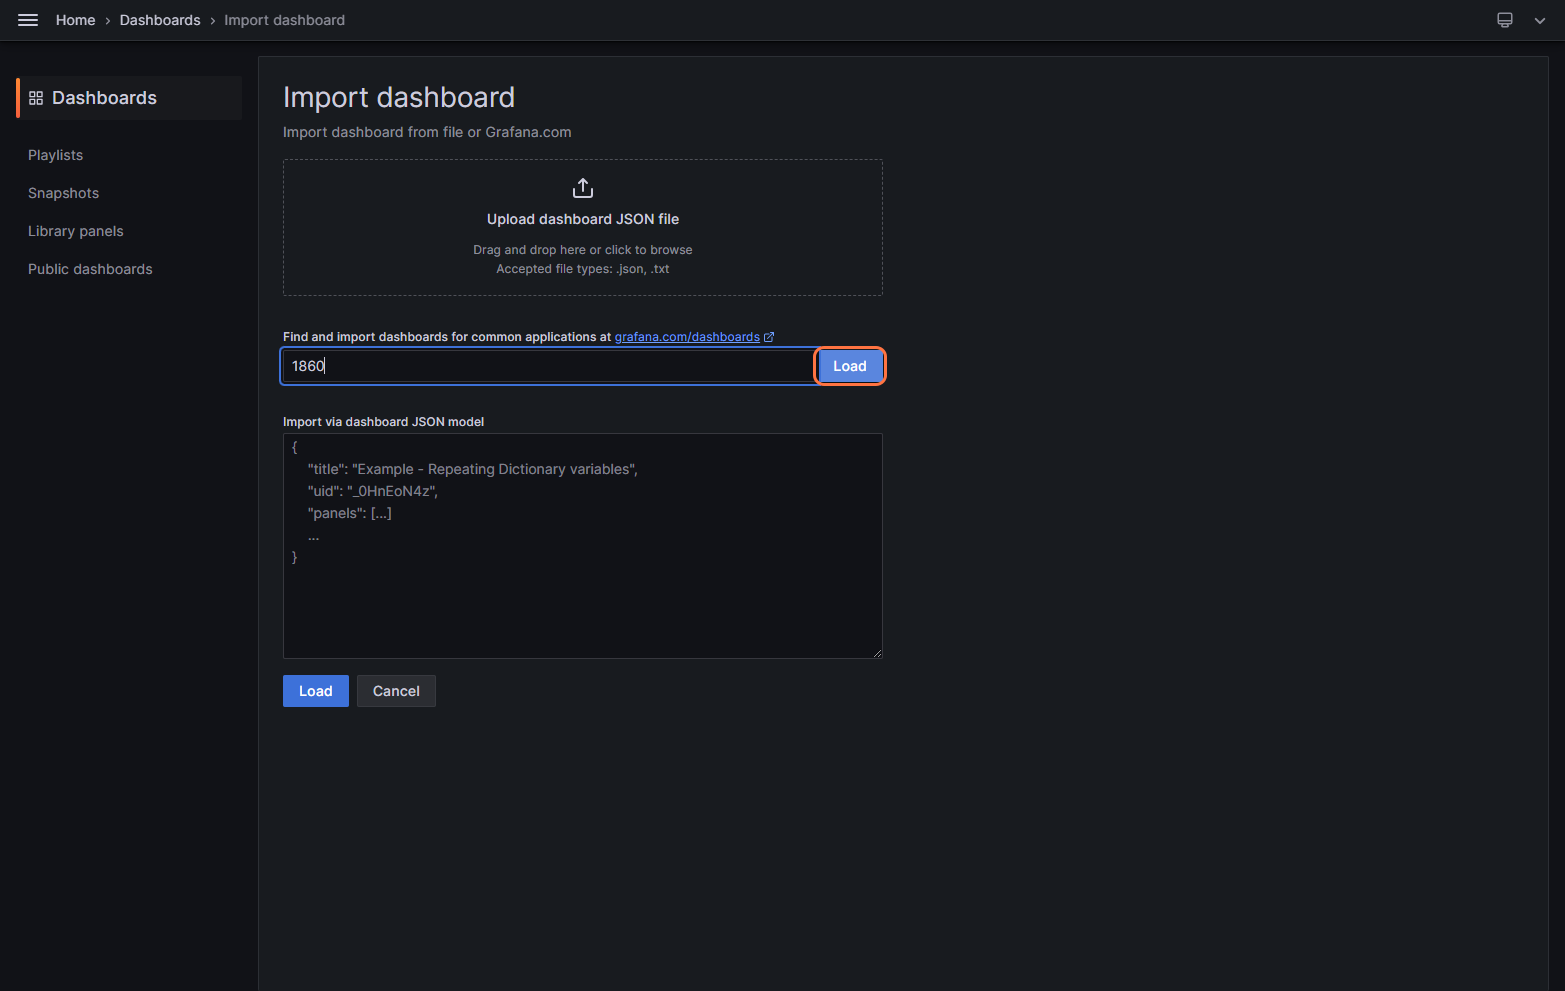
5. We will be pasting this Dashboard ID to the Import Dashboard section. Next, select the Prometheus data source that we just created. In Grafana, we automatically load a Dashboard and show us the metrics.
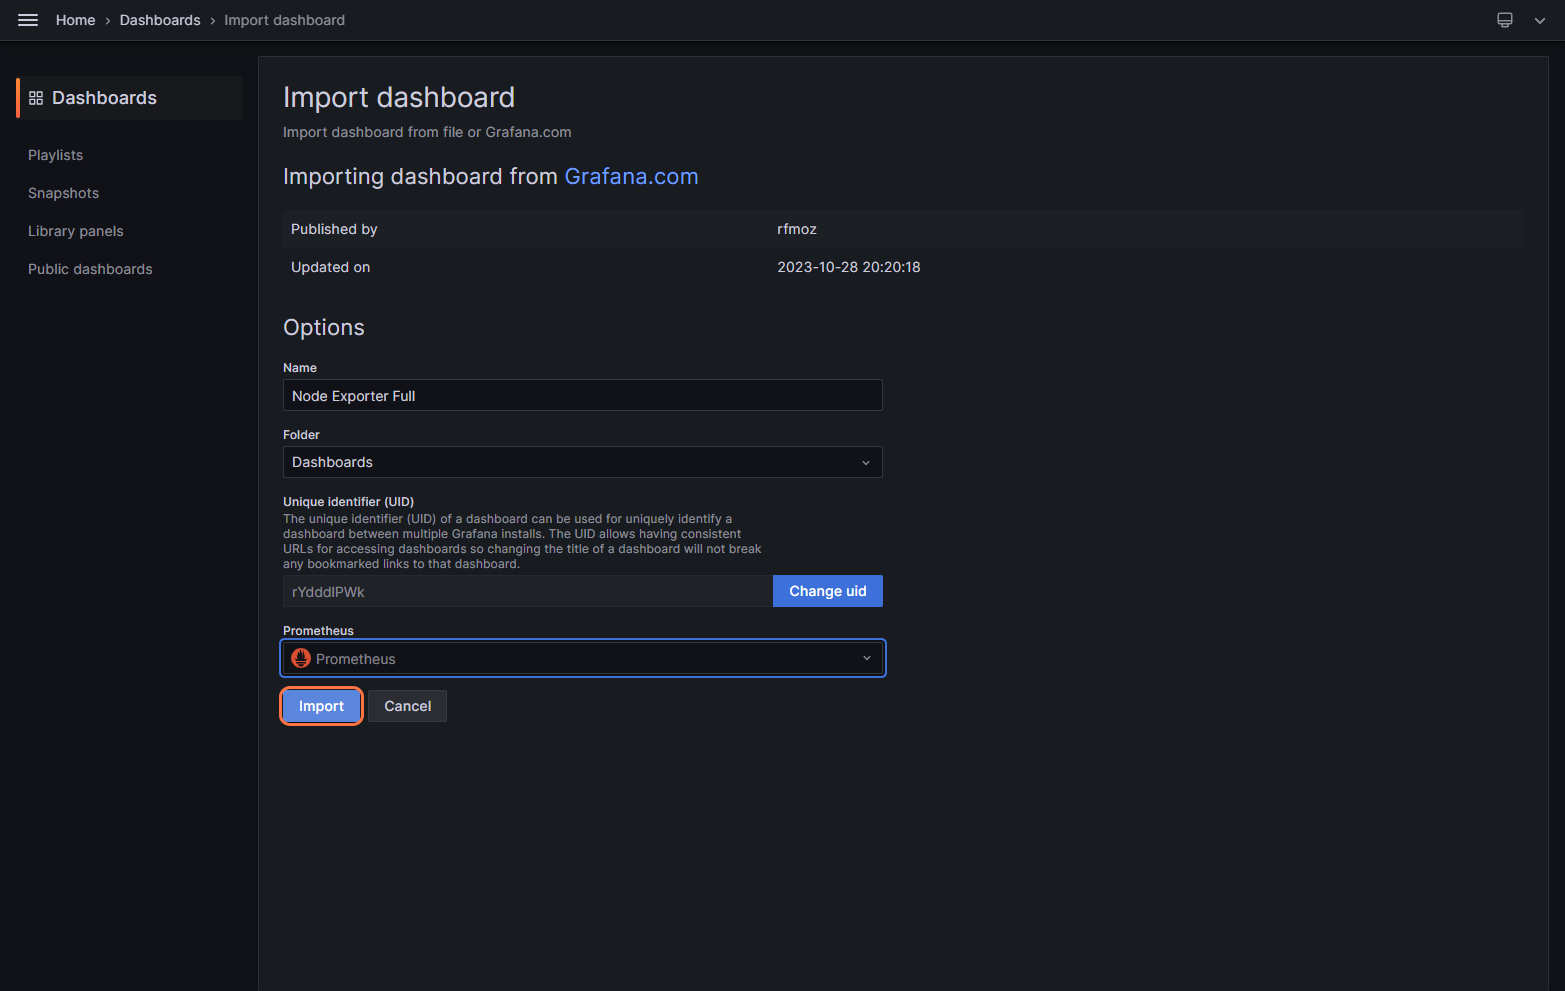
Finally, we will get our Grafana dashboard ready.
Hurray! We have successfully created our Grafana dashboard. Now, you can visualize all your metrics that the node exporter is scraping for us. You get many different stats about your resources in a visualized manner.

This is the time for you to explore!!
Conclusion Congratulations! We have successfully set up our tools for monitoring the resources. With Prometheus for metrics collection, Node Exporter for machine metrics, and Grafana for data visualization, you’re well on your way to gaining valuable insights into your AWS resources. Do it by yourself to get a good grip on the concepts. There are many ways you can use these tools to gain insights into your resources, and there are a lot more blogs to gain more insight. Visit CloudZenia for more insightful information. Happy Monitoring (with Prometheus and Grafana, haha)!

Ujjwal Mahar Linkedin Dec 13, 2023
Filed under