

One of the most widely used tools for monitoring resources is Prometheus. Let's see how to set it up on AWS EC2 and how the Prometheus architecture would look like.
Introduction
Prometheus software is a monitoring solution that is responsible for collecting the metrics data and gives us the ability to visualize the collected data. Still, we will be using Grafana today, as it is more focused on the data visualization part. Prometheus works in such a way that it scrapes the specific target whose HTTP endpoint is exposed; the scraped metrics from the target are then stored in a time series database that can be queried using PromQl (Prometheus query language). When you install prometheus it allows you to generate alerts when the metrics reach the specified threshold. Imagine Prometheus in such a way that your older sister tells you to have a look at what your mom is making and give her updates every 10 minutes. The act of you checking the kitchen is similar to how Prometheus is scraping metrics from the specified targets at regular intervals. Just as reporting her back to your sister is similar to how Prometheus stores the collected data and makes it available for you, if anything goes wrong (like the soup boiling over), you alter your sister immediately; similarly, Prometheus can trigger alerts. The metrics scraped by Prometheus can be visualised using Grafana. Grafana provides us with lots of amazing dashboards for data visualization. Data can be visualized in the form of charts and graphs, and we can also use Grafana to aggregate logs using Grafana Loki So, let's see how we can use, install, and configure Prometheus to monitor our AWS EC2.

Setting up AWS EC2 To answer the question of “how to set up EC2 instance in AWS”, we will be using a single EC2 instance to set up Prometheus, Node Exporter, and Grafana. Let's start by launching our EC2 server.
Steps by Step Guide :
- Open the Amazon EC2 console.
- Launch an instance.
- Choose Ubuntu as the AMI (Amazon Machine Image).
- Choose an Instance Type for this blog; we will be using t2.micro
- Generate a key pair.
- Leave the rest as default; we will be configuring it later.
- Next, launch instance. If you have any trouble setting the EC2 instance, you can always refer to the gif below.
Configuring Security Rules
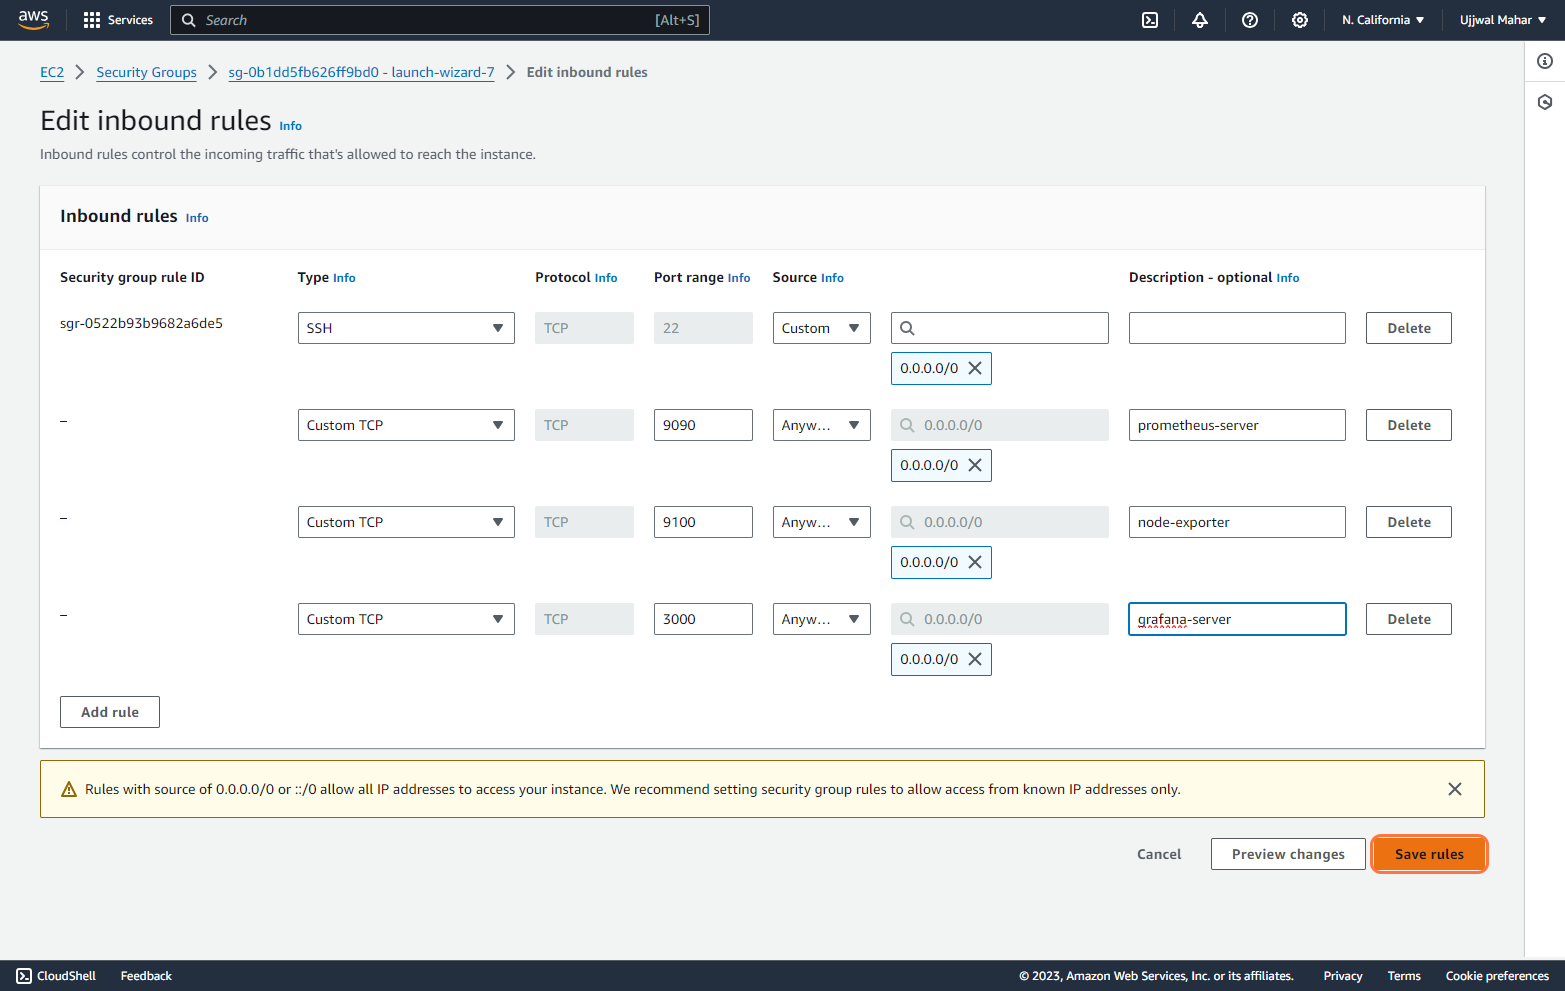
For running the Prometheus server, node-exporter, and Grafana server, we need to edit inbound rules so that we can access them (as we are using a single instance). To successfully install and configure Prometheus, here are the inbound rules, Follow the steps:-
- Navigate to the security sections and go to security groups.
- Next, click on Edit inbound rules and then Add rule. We will add rules for Prometheus, node-exporter, and Grafana.
- Now select the Type to Custom TCP, Port range 9090 for Prometheus, 9100 for Node Exporter, and 3000 for Grafana, CIDR block to 0.0.0.0/0, and add the description. Then Save the rules, they must look something like this :
- Now that we have our inbound rules set up, we can now start creating our Prometheus server setup. Go to your instance and update the package using sudo apt-get update
Installing Prometheus Server in EC2 To answer
“How to install Prometheus”, let's start by creating a new user other than the root user. And making the Prometheus directory under /etc/ and /var/lib/ directory.
#This command is to create user prometheus without the home directory
sudo useradd --no-create-home prometheus
#Making prometheus directory under etc
sudo mkdir /etc/prometheus
#Making prometheus directory under lib
sudo mkdir /var/lib/prometheus
We are using --no-create-home user because we are going to use the prometheus user for a specific purpose, i.e., for using it as a service. We do not want it to interact with the user for any kind of login or personal use. So it is better to use this than using the root user for everything. Once our directory is set up, we need to install Prometheus.
To download Prometheus, go to DOWNLOAD and copy the link. Or just use the following command to install Prometheus 2.48.0; it will download the tar file.
# To download Prometheus 2.48.0 wget https://github.com/prometheus/prometheus/releases/download/v2.48.0/prometheus-2.48.0.linux-amd64.tar.gz
To unzip the tar file tar xvfz prometheus-2.48.0.linux-amd64.tar.gz use the following command, and it will generate the untared file.
To check the untared, use the ls command. You were using the bare matel; you can just go into the prometheus-2.48.0.linux-amd64 directory and run ./prometheus to start your server.
You can also install it in your EC2 instance, but we will install it in our system so that we can use systemctl commands. The following commands will be used to install the Prometheus toolkit in our system (command is explained using a comment) :-
#Copy the Prometheus binary to /usr/local/bin sudo cp prometheus-2.48.0.linux-amd64/prometheus /usr/local/bin #Copy promtool to /usr/local/bin/ sudo cp prometheus-2.48.0.linux-amd64/promtool /usr/local/bin/
Need help with your cloud infrastructure?
Our experts at CloudZenia are ready to help you build, scale, and secure your setup.
Book a Free Consultation# Copy the consoles directory to /etc/prometheus sudo cp -r prometheus-2.48.0.linux-amd64/consoles /etc/prometheus
#Copy the 'console_libraries' directory to /etc/prometheus sudo cp -r prometheus-2.48.0.linux-amd64/console_libraries /etc/prometheus sudo cp prometheus-2.48.0.linux-amd64/promtool /usr/local/bin/
#Remove the Prometheus archive and extracted directory rm -rf prometheus-2.48.0.linux-amd64.tar.gz prometheus-2.48.0.linux-amd64
Now we need to add a prometheus.yml file that will have the configuration file for the prometheus. sudo vi /etc/prometheus/prometheus.yml Let's add the configurations once we are in our newly created prometheus.yml. global: scrape_interval: 15s external_labels: monitor: 'prometheus' scrape_configs: - job_name: 'prometheus' static_configs: - targets: ['localhost:9090'] Let's see what this configuration is :
Global Configuration(global)
- scrape_interval: This sets the interval at which Prometheus scrapes targets for metrics. In this case, it is set to 15 seconds (15s).
- external_labels: These are labels that are applied to all scraped metrics. In this case, there is one label named monitor with the value 'prometheus'.
Scrape Configurations (scrape_configs):
- - job_name: 'prometheus': This is the name of the job. In this case, it is named 'prometheus'.
- static_configs: Defines a list of targets to scrape metrics from.
- - targets: [' localhost:9090 ']: This specifies that Prometheus should scrape metrics from the target, where presumably the Prometheus server itself is running. Now that our configuration of Prometheus is done, we will have to add a service file that will define how our Prometheus service will be managed by systemd. [Unit] Description=Prometheus Wants=network-online.target After=network-online.target [Service] User=prometheus Group=prometheus Type=simple ExecStart=/usr/local/bin/prometheus --config.file /etc/prometheus/prometheus.yml --storage.tsdb.path /var/lib/prometheus/ --web.console.templates=/etc/prometheus/consoles --web.console.libraries=/etc/prometheus/console_libraries [Install] WantedBy=multi-user.target Let's understand what we are doing here:
Unit Section ([Unit]):
- Description: is a human-readable description of the service, indicating that this unit is for Prometheus.
- Wants: Indicates a dependency on network-online.target , meaning that this service should not start until network services are available.
- After: Specifies that this service should start after network-online.target .
Service Section ([Service]):
- User=prometheus: Specifies the user under which the Prometheus service should run. This is likely the user you created earlier for Prometheus.
- Group=prometheus: Specifies the group under which the Prometheus service should run.
- Type=simple: Indicates that the service type is a simple process that does not fork.
- ExecStart: Specifies the command to start the Prometheus service. It includes the path to the prometheus binary and various command-line options:
- --config.file: Specifies the path to the Prometheus configuration file.
- --storage.tsdb.path: Specifies the path to the directory where Prometheus should store its time-series database.
- --web.console.templates and --web.console.libraries: Specify the paths for the web console templates and libraries.
Install Section ([Install]):
- WantedBy= multi-user.target : Specifies that this service is wanted by the multi-user.target , meaning it will be started as part of the multi-user system startup. Finally, we will change the file permission we just created:- sudo chown prometheus:prometheus /etc/prometheus sudo chown prometheus:prometheus /usr/local/bin/prometheus sudo chown prometheus:prometheus /usr/local/bin/promtool sudo chown -R prometheus:prometheus /etc/prometheus/consoles sudo chown -R prometheus:prometheus /etc/prometheus/console_libraries sudo chown -R prometheus:prometheus /var/lib/prometheus Next, is to reload system configuration, so that it could take the new configuration that we added. Then we will enable the Prometheus service to start at the boot. Lastly, we will start the service. To check the status of the service is running or not, use sudo systemctl status prometheus.
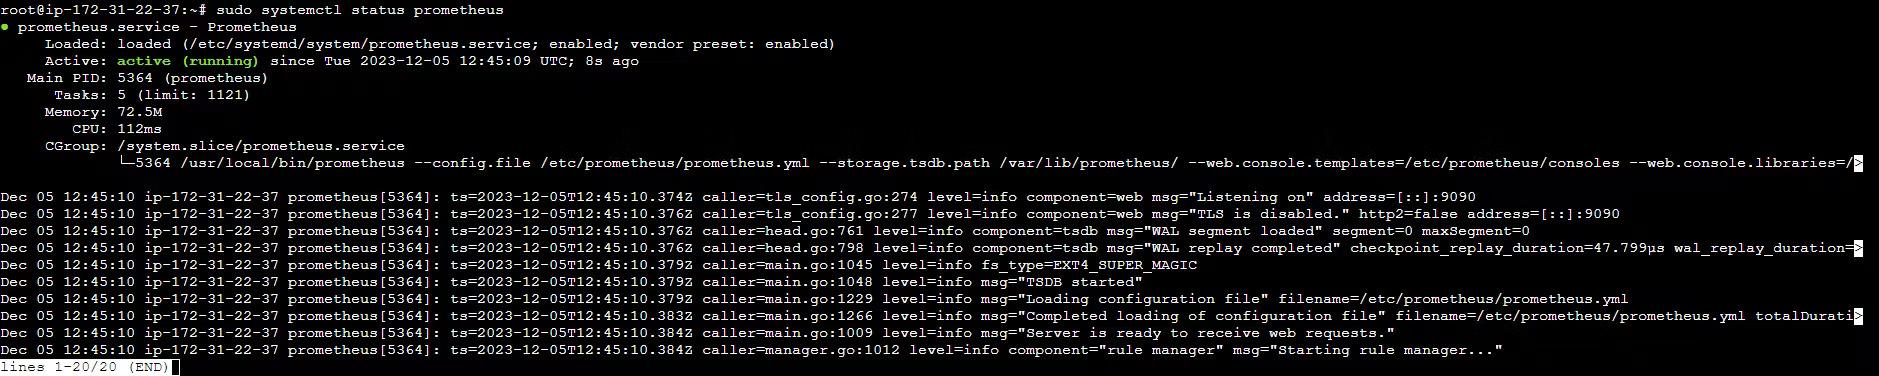
Hooray! Prometheus service is successfully configured. Let's check how it looks: Just go to the new tab and enter <your-public-ip>:9090.
Yay!! We successfully configured the Prometheus service.
Conclusion
And, there you have it! We were able to successfully set up Prometheus on the EC2 instance. Just remember, this is the beginning. The world of cloud monitoring is vast and constantly evolving. There are always new metrics to track, new issues to troubleshoot, and new ways to optimise your cloud resources. We would suggest you check out our other blogs too, on the CloudZenia website, like Step-by-Step Tutorial: Monitoring AWS Resources with Prometheus and Grafana. Loads of gratitude for reading our blog. Keep exploring and learning!

Ujjwal Mahar Linkedin Dec 11, 2023
Filed under