
Introduction
When websites need to handle many visitors at once or keep their pages loading quickly, they rely on something called “performance testing”. A popular tool for this is JMeter, developed by the Apache Software Foundation. It’s a free, open-source software used by testers and developers to check how web applications and services perform under stress.
The JMeter tool is beginner-friendly and not just for experts. It helps simulate lots of users visiting a website to see how it performs under various conditions. This is crucial before launching a new website or implementing significant updates, ensuring that the site stays responsive and stable. Also, the jmeter download and installation process is quite simple, making it easier to access.
1. Installation on AWS EC2
- Create one EC2 server and SSH into it. (Use Ubuntu 22.04 AMI)
- Upgrade packages.
sudo apt update
sudo apt upgrade- JMeter is built on Java, so install it first.
sudo apt install default-jdk- Download the latest version of Apache JMeter.
https://dlcdn.apache.org//jmeter/binaries/apache-jmeter-5.6.3.tgz- Check the downloaded file, unzip it and change the name for ease.
ls
tar -xvzf apache-jmeter-5.6.3 tgz
mv apache-jmeter-5.6.3 jmeter- Move it into /opt directory,
sudo mv jmeter /opt- Add JMeter path to .bashrc so no need to specify the path each time.
echo 'export PATH="$PATH:/opt/jmeter/bin"' >> ~/.bashrc
source ~/.bashrc- Now you can run the JMeter simply by running the jmeter command.
jmeter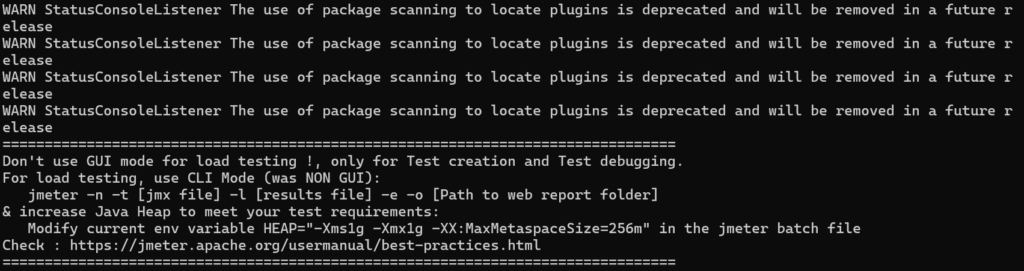
2. Setup Jmeter UI
The steps mentioned above are for setting up the JMeter server and making it ready for use. Although JMeter recommends using the JMeter CLI for any kind of testing, we need a script for the specific API that needs to be tested. Here is an important point: we cannot create scripts using CLI; for this, JMeter already provides an easy option, which is the JMeter GUI.
We cannot directly open any package/software UI; for that, X11 forwarding should be enabled, which will help to open the respective UI using the particular host IP and Port. Instead of enabling all the setup and installing libraries required for X11 Forwarding, we can use PuTTY or MobaXterm. We just need to enable the X11 forwarding option, and we are good to go.
I am using MobaXterm for this demo. Open MobaXterm and connect to your JMeter server using your PEM key and the public IP of your server.
Note: While connecting to the server, please enable X11 forwarding. After a successful connection, please install the necessary packages for X11.
- Please install the necessary packages required for X11 using the below command,
sudo apt install mesa-utils3. Creating JMeter Script for testing
After the JMeter UI appears, enlarge it to start creating your script. There are different types of testing, such as performance testing, and load testing. I am creating a script for load testing. The resources below will help understand the JMeter components and elements required to create scripts:
- Any load-testing scripts typically contain the following elements:
- Thread Group: The number of users you need to test for.
- HTTP Request: Specifies the endpoint you are testing.
- HTTP Header Manager: Needed if authorization is required.
- Results Tree/Summary: Displays the output of the load test.
- After creating the script save it in .jmx format, later we have to run this file using JMeter CLI.
4. Simulate Users and Apply Load on the Server (Actual Load Testing via JMeter CLI)
After creating the script, save it in your home directory or wherever you prefer. Modify it according to your needs, such as adjusting the ramp-up period and specifying the number of users to hit. Use the command below to run the script:
Note: In this example, I am simulating 11 users (Thread Group) with a ramp-up period of 20 seconds. I will modify the script accordingly. Check the demonstration in the video below.
You have to modify the script as mentioned below,
<ThreadGroup guiclass="ThreadGroupGui" testclass="ThreadGroup" testname="Thread Group">
<intProp name="ThreadGroup.num_threads">11</intProp>
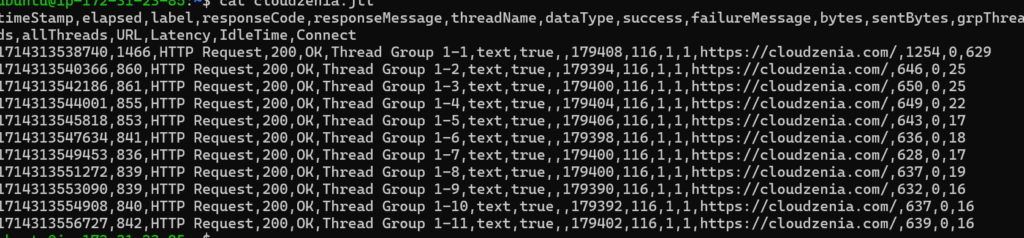
<intProp name="ThreadGroup.ramp_time">20</intProp>jmeter -n -t <script.jmx> -l <result_scipt.jtl>The command provided above will run the script of the specified name and store the results in a .jtl file. You can analyze the test results to understand various metrics such as how many threads failed, whether the server was unable to fulfil requests, the average response time, and much more.
This is how the result file will look like,
Disclaimer
In this demo, we will put the load on a simple GET REST API that does not require authorization or a token to receive a response. In an actual environment, you may require a token and other types of authentication methods, so the script will need to be adjusted accordingly.
Conclusion
The purpose of this demo is to provide you with a high-level overview of JMeter, including how to install JMeter, create scripts and use the JMeter CLI for load testing. The key point is that once you create the scripts, you simply need to run them using the command provided. I recommend going through the provided links to understand the main elements of the script and how JMeter works.
For more information on technology and know-how about the different tools, visit our CloudZenia website.